Modern audio gear and software comes loaded with meters to try and give visual indications of signal levels and a host of other information. The problem is that a lot of us don’t really understand exactly what our meters mean and what they’re trying to show us.
There are dozens of ways that understanding how to interpret meter readings can help you. To this end, we’re going to take a closer look at decibels, then examine some of the various meters, dials, gauges and indicators in more detail. This should help you understand how they all work and how they will be useful to you in your music making.
What's a decibel?
The hardest part about metering is getting to grips with exactly what a decibel is. In fact, many experienced engineers and producers struggle with the scientific definitions.
A decibel is most accurately described as a logarithmic method for measuring the magnitude of a signal relative to a given reference level. Only when we know what the reference point is does the decibel measurement take on any real meaning. As such, there are a number of different signals that can be measured using decibels, although for audio purposes we’re mainly interested in acoustic sound signals and (analogue) electronic sound signals.
Part of the reason why so many people find this confusing is that most of the time, we foolishly insist on referring to each of these different measurements simply as ‘a decibel’ and abbreviating them all to ‘dB’. What we should be doing is specifying what the reference point is.
The result of this lazy naming is that we often have to infer the reference point from the context. There are three main areas where you’ll find decibels used for audio measurements, and the context should give you a clue about which type is being used.
Probably the most common everyday use of the decibel unit is as a measurement of the level of intensity of an acoustic sound. This is more accurately termed dB(SPL) and is referenced to sound pressure level in air, where 0dB(SPL) equates to 20 micropascals (uPa). This measurement of micropascal is the lowest pressure (and therefore quietest sound) that can be perceived by the human ear.
For electrical audio signals, the most common scales used to measure level are dBu (the professional standard) and dBV (more common in consumer equipment). In the case of the dBu, it is referenced to a signal with a root mean square magnitude of 0.775 Volts (RMS is essentially a method of calculating the average magnitude of a wave with positive and negative elements), while dBV is referenced to 1V RMS.
If you’re working exclusively with professional equipment then you can just about forget that dBV exist and concentrate on dBu. The only caveat is that you should pay attention to capital letters – dBu was originally known as dBv and is occasionally still referred to in this way by Americans. The dBv unit is exactly the same as dBu. We did warn you that decibels can be confusing!
Decibel meters on hardware and in software are usually used to display dBFS or dBVU, measurements of the level of a signal relative to a defined maximum (in digital equipment this is the point just before clipping occurs, whereas in analogue equipment it refers to the highest level before the signal starts to degrade). In digital equipment, 0dBFS is the highest possible signal level. Attempting to push a signal beyond this level will instantly result in the waveform becoming squared off at the peaks. On professional audio equipment, 0dBFS is usually set at +4dBu.
Commercial equipment tends to use -10dBV as the 0dBFS reference point. Analogue equipment tends to use dBVU (referenced in Volume Units) in a similar way to dBFS, where 0dBVU is the nominal maximum signal level. The Volume Unit is a hangover from the days of analogue radio broadcasting and tape recorders, where 0VU was the highest allowable signal level. Whether you’re working with digital or analogue, any signal above 0dBFS or 0dBVU is usually bad news in terms of sound quality.
Sound pressure levels explained
One of the most common uses of decibels is to measure sound pressure levels. The measurement dB(SPL) is the one most people use to refer to how loud a sound is. To confuse things, SPL measurements are sometimes made using weightings designed to replicate the response of the human ear. A-frequency weighting is the most common system, based on the equal loudness contours, while C-weighting is used to measure peak sound pressure.
SPL meters often have a speed setting for adjusting how quickly the meter responds to level changes. The S (slow) setting usually uses a 1s integration time, F (fast) uses 125ms and I (impulse) uses 35ms.
In the studio, the most important use for an SPL meter is to measure your monitoring level. Prolonged exposure to high sound pressure levels not only leads to fatigue, it can also cause long-term damage to your hearing. As a result, it’s advisable to determine your preferred monitoring level and stick to it, avoiding the temptation to push the master level control up.
Typically your monitoring level should be calibrated with a pink noise reference signal (at 0dBFS) and the SPL meter in your listening position set to C-weighting, slow response. We’d recommend picking a level somewhere between 80 and 90 dB(SPL), although some prefer even lower levels.

Notching nasties
Almost all sounds, whether produced acoustically or electronically, contain resonance. This is where certain frequencies are amplified as a result of the ‘construction’ of the sound and the way it is subsequently produced.
These can become exaggerated to the point where they become unpleasant. However, even before such extremes, it’s a common producer and mix engineer’s task to target unpleasant, prominent frequencies and employ EQ tools to lessen volumes at specific points where needed. It’s important that such ‘nasties’ are removed prior to mastering as the broader mastering process could boost this unpleasantness further.
The process of removing problem spots in the frequency range is known as ‘notching’ because, rather than using EQ to soften, brighten, energise or dampen a whole range of frequencies, you are reducing the bandwidth to a sharp, narrow point; identifying the offending frequency and then hugely reducing its volume, leaving the rest of the sound ‘intact’.
There are three parameters to be adjusted when it comes to a notch EQ: frequency, which is necessary to target the problem spot; bandwidth, in order to set a narrow range around this point; and gain reduction, to remove volume. Visual tools work to make all three parameters easy to identify and adjust.

Captain's log
One of the most important things to remember about all of these measurements is that the decibel scale is logarithmic. As such, a 100dB signal doesn’t have twice the power or amplitude of a 50dB signal and isn’t perceived to be twice as loud (power, amplitude and perceived volume are related, but not directly proportional). The base-10 logarithmic scale used by decibel measurements means that a 3dB increase in signal level equates to doubling the signal’s power, while a 6dB increase equates to doubling the signal’s amplitude.
Whether you're working with digital or analogue, any signal level above 0dBFS or 0dBVU is bad news
However, the human ear’s response is also logarithmic, so it takes a level increase of approximately 10dB for the signal’s volume to be perceived as twice as high. Bear in mind also that this is true no matter whether you start at 10dB or 100dB, so 20dB(SPL) is perceived to be twice as loud as 10dB, while 110dB is twice as loud as 100dB. Small numbers on the decibel scale can relate to significant perceived level changes, so always be suspicious of anyone who uses phrases like, “It’s only a few dBs”!
VU and PPM
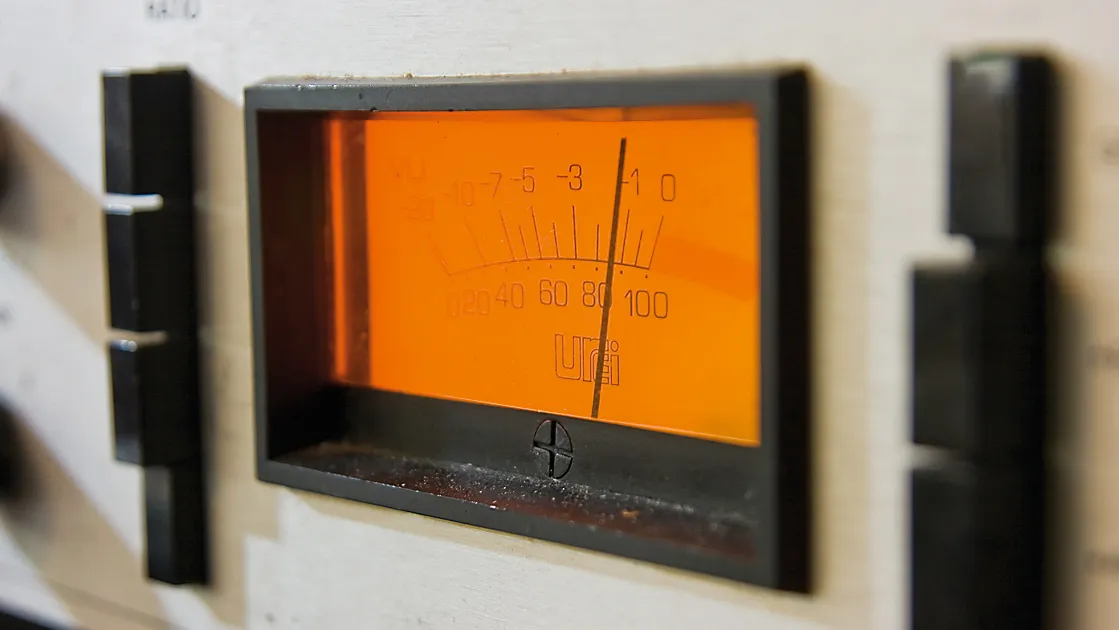
A very specific type of level meter known as a VU meter was commonly found on hardware in the analogue era. VU is sometimes erroneously used to refer to any mechanical signal level meter, but the VU metering system is just as clearly defined as the various decibel scales. VU meters display the average level of the signal, with the meter taking 300 milliseconds to rise from zero to its full level when a signal of 0VU amplitude is applied.
Since the VU meter is so slow to respond, it isn’t useful for monitoring peak levels but should be used to monitor overall averages or average perceived loudness. Many VU meters feature an integrated peak level LED indicator to aid peak detection. It is worth noting that some level meters in hardware and software exhibit pseudo-VU style damped readings without truly following the VU specification.
Care should be taken whenever you’re unsure whether a true 300ms integration time is being used. Peak programme meters (PPMs) are similar mechanical meters but with a much shorter 5ms integration time in order to display audible peaks in signal level. Unlike VUs, which fall as quickly as they rise, PPMs typically take between 1.5 and 3 seconds to fall back 20 to 26dB after they hit a peak (the fallback time varies by country). This means peaks can be held by the meter, making it easier for you to read their level.
Spectrum analysis
Spectrum analysers are the easiest analysis tools to use and probably the most commonplace after level meters – so much so that they were once a regular feature on home hi-fi equipment. This is mainly because they looked pretty as they bounced around in time with your music. Old-fashioned spectrum analysers break the signal down into a series of frequency bands and display the levels (typically average and peak) of each band independently.
More advanced modern software versions display a continuous curve, representing all audible frequencies. Most DAWs have a built-in spectrum analyser either in the EQ or as a separate plugin. Alternatively, check out commercial options such as Nugen Audio’s Visualizer, which includes many of the tools discussed here.

Analysers can be put to a range of uses during production. Primarily, they can be a visual aid for EQ and mixing challenges. The frequency range of a sound can be quickly identified to determine where it sits in comparison to other elements. Unwanted low- or high-frequency content can be identified and the response of the entire mix can be analysed and compared to other tracks to see if it’s hitting the same frequencies as a good commercial mix.
A further variation on the spectrum analyser is the waterfall diagram, which introduces time on a third axis, creating a three-dimensional graph of how the level of each frequency band changes over time.
Spectrographs (often referred to as spectrograms after the name of the diagram they generate) are tools that produce a two-dimensional representation of the same data shown in waterfall diagrams. Rather than using a third axis, spectrograms typically represent time along the x-axis, frequency up the y-axis and level using colours. Many people find them easier to read than 3D waterfall diagrams.
Advanced analysis tools
So what are analysis tools? A good clue for the question above comes from another term sometimes used to describe them: sound visualisation tools. Though it has been appropriated by the iTunes-style visualisers, which create pretty patterns in time with the beats and melodies, it refers here to tools that provide a visual indication of the key sonic characteristics of signals you feed them.
This is very useful for a simple reason: we can’t always hear the fine details of an audio signal as well as we’d like. Aside from the limitations of human hearing, there are other factors which come into play here.

No monitoring setup is 100% accurate, transparent and revealing. In addition, some frequencies are beyond the range audible by humans. The lowest sub-bass frequencies can’t be heard by anyone who listens to your music or reproduced by even the heaviest club sound system – but they still end up taking up valuable bandwidth in your mix.
Spotting the presence of that low-end signal with a spectrum analyser would give you a clue that rolling off the bottom end with a high-pass filter could free up some bandwidth and allow you to make the rest of your track louder. Even if it only helps you to bump the rest of your mix up by a fraction of a decibel, that’s still a valuable improvement.
Peak indicators
Let’s take a closer look at peak indicators, those tiny red LEDs that tell us a signal is too hot for our gear. On analogue equipment, it’s not the end of the world to see the peak LED indicator flicker momentarily every now and again (pushing into the red might even result in pleasant analogue distortion) but on digital equipment it should be avoided at all costs, especially when recording.
In the days of analogue tape, it was desirable to use up every last bit of headroom in order to maximise the signal-to-noise ratio and dynamic range of the recording. However, this practice is no longer necessary with digital equipment, due to higher dynamic range and improved SNR. Furthermore, exceeding 0dB results in the painful and highly undesirable sound of digital clipping. At best, that means another take to fix the problem. At worst, you’ve ruined the recording and won’t get another chance.
Although many recording engineers will have their own slightly higher or lower preferences, we’d advise you to try and hit a peak level of around -15 to -12dBFS when recording to a 24-bit digital format (see issue 312 for more). Leaving this much should minimise clipping while giving you dynamic range and SNR far in excess of analogue tape. Even when mixing in your DAW, remember to keep your levels down. It’s a common mistake to push all the faders up and then use a peak limiter plugin on the master buss to bring the output level back down to 0dBFS without realising you’re harming your signal.
Aim to leave headroom in every step of the signal chain (including between effects plugins) and you’ll ensure that no damage is being done.
Oscilloscopes
Oscilloscopes are one of the most important tools for electronic testing and signal analysis, allowing waveforms to be visualised in real time. Originally developed as hardware units, oscilloscopes were primarily designed for engineers to test the functionality of electronic circuits on a variety of gear (not just for audio and not just operating in the audible frequency range). They are often used with function generators – similar to synth oscillators, but with a much higher frequency range – which feed a test waveform into the circuit.

For audio purposes we already have a waveform to test – the audio signal itself – but not all signals are suitable for oscilloscopes. Oscilloscopes tell us most about signals of relatively stable frequency, amplitude and harmonic content. With these signals we can synchronise the oscilloscope’s scan period with the frequency of the wave, making the waveform appear stationary on the display (most software scopes will do this automatically).
Want to check the inaccuracies that make one synth’s raw square wave sound fatter than another’s? Want to see how a low-pass filter rounds off the shape of that square wave until it’s a pure sine? How a distortion effect turns that sine slowly back into a square as you crank up the gain? You need an oscilloscope.
It’s the best way to visualise that kind of simple process. Oscilloscopes aren’t the kind of equipment you’d use every day, but for visualising simple signals in real time they’re unbeatable and a great tool for learning about synthesis. Blue Cat’s Oscilloscope Multi, is still a decent example, and available for all platforms, for $49.
Stereo correlation metering
Things get a little more advanced when you begin using tools that make comparisons between two channels of audio (spectrum analysers and spectrographs typically simply average the two stereo channels when used in stereo mode). There are a number of highly specialised tools that use comparisons to provide us with information on variables such as phase and the stereo relationship between left and right channels.
These tools take various names – balance meters, vectorscopes, stereoscopes, correlation meters and goniometers are probably the most common – and all represent the results in slightly different ways (typically a correlation bar running from -1 to +1 or L to R, a polar stereo map, or a ‘Lissajous figure’ – a form of metering that is a little more tricky to read but can give very detailed information on phase, frequency and stereo relationships).
All these tools essentially do a similar job of comparing two channels of audio. That usually means the left and right side of a stereo pair, but there are occasions when you’d want to compare two mono signals. For instance, you might want to check for phase cancellation when double-tracking, recording with multiple microphones or using parallel processing techniques.
Advanced metering
Every DAW will include basic metering functions on channel strips, in the mixer section or as a utility plugin, but if you want to take your metering to the next level, there are a number of more advanced ways to visualise your sound signals, most of which involve measuring multiple variables. Metering starts to get a little more interesting when we measure another variable alongside the amplitude of the signal and the most common way of doing this is to measure frequency.
A spectrum analyser displays the levels of a number of frequency bands to show their relative amplitudes. Oscilloscopes measure amplitude and time in order to give a visual representation of the waveform you route into them. Spectrograms add a time element to the spectrum analyser, plotting three variables simultaneously in order to show how the spectral composition of a signal develops. These meters are incredibly powerful tools and a thorough understanding of how to use them will pay dividends in the long run.
