Going in blind with acoustic treatment is always a gamble, but we can take the guesswork out of the equation by measuring our progress with acoustic measurement software like the free Room EQ Wizard (REW). To get going, you'll need an omnidirectional mic (a cheap one like the Behringer ECM8000 can had for under £50), a stand to hold it, and an audio interface with the necessary mic input.
The basic idea behind REW is to play a sine sweep through the frequency spectrum. Behind the scenes, some fancy calculations are then performed to generate a series of data plots that show us exactly where the problems in the room are. The ones we're interested in are the frequency plot, the waterfall plot and the Energy Time Curve (ETC) plot.
Going in blind with acoustic treatment is always a gamble, but we can take the guesswork out of the equation by measuring our progress with acoustic measurement software.
The frequency plot displays the frequency response of the room. We're usually interested in the sub-300Hz region (showing how the room modes are affecting bass response), checking to see if there are any excessive peaks or nulls in the spectrum that can be addressed through speaker, listener and acoustic treatment placement. In a well-treated room, we'd expect the difference between the largest peaks and troughs of our modal region to be under 10dB, but anything under 20dB is a good start.
The waterfall plot displays the time it takes for frequencies to decay to silence over time. As with the frequency plot, we're interested in the modal region (sub-300Hz), so we can plan our strategy for soaking up that excessive modal energy. It's not uncommon to have a long, honking room mode at the very low end - trapping lower frequencies can be very difficult - but any improvement in reducing modal ringing will have a positive effect on the way you mix.
The ETC plot is a time vs amplitude plot - it displays the early reflections arriving after the direct signal. We're interested in the first 30ms or so to ensure that the early reflections (spikes on the downward curve of the plot) are at least 30dB quieter than the direct signal.
When taking measurements, we'll measure the left speaker, the right speaker and both speakers together. This way, we can check how each speaker is performing and contributing to the stereo response of the room, and make adjustments to the position of each accordingly. It's useful to keep an archive of measurements along with photos of speaker/listener positioning so you can retrace your steps if you move away from your sweet spot.
For much more advice on optimising your studio acoustics, pick up Computer Music 212, which is on sale now.

Step 1: Calibrate your audio interface according to REW's instructions and fire up the software. Place your mic where your head normally is when mixing, pointing it at either speaker to measure one at a time or at the centre-point between them for L+R measurements. Set the Start and End times to 20Hz and 20kHz, and crank up your monitors reasonably loud.

Step 2: Click Measure>Start Measuring, then move at least six feet back behind the mic so that your body doesn't influence the measurement. Click the SPL & Phase tab to bring up the frequency plot (uncheck the Phase box at the bottom, as we won't be looking at that in this tutorial). To view multiple measurements at once, you can instead use the All SPL tab and check the boxes for what you want to display.

Step 3: We want to frame the plot so that we can view only the relevant part of the spectrum within a sensible dynamic range - in this case, we want to view the sub-300Hz range. Click the Limits button and set the Left value to 30Hz, the Right value to 300Hz, and the Top and Bottom values so that you have around 30dB difference, or as much as you need to see the highest peak and lowest trough.

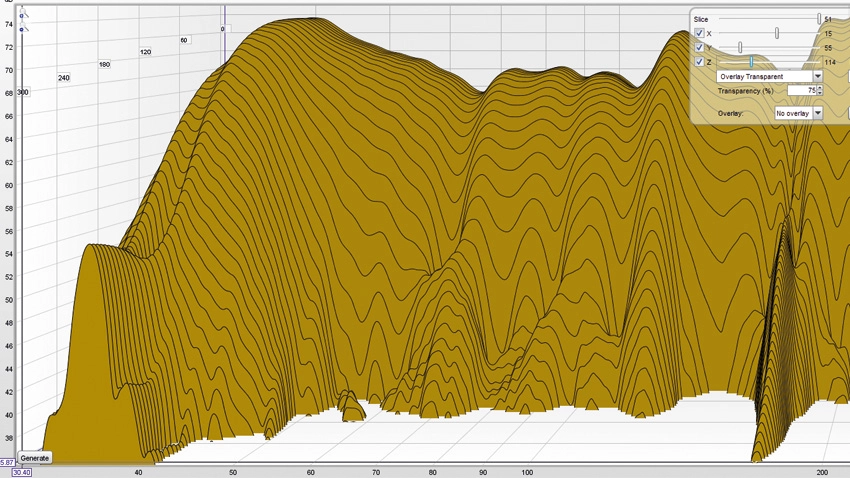
Step 4: Now click the Waterfall tab to see the plot your room has created. At the bottom left, click the Generate button to create the waterfall plot. Now set the Limits to the same settings as the frequency plot, but with a 40dB difference. Don't worry if your plot looks different from ours - we'll tweak it next.

Step 5: Let's adjust the display of the plot to get a better view. Click the Controls icon and Set X to 15, Y to 55 and Z to 114 - this gives a good starting point. Move the scrollbar on the left up or down if needs be, to make sure the highest peak is still in view. The frequencies that take longer to decay can be tamed with more bass traps.

Step 6: Now click the Filtered IR tab to bring up the ETC plot. Framing plots to sensible parameter ranges is key to reading the data, so click the Limits tab and set the Left to 0, the Right to 0.03 (30ms), the Top to 0 and the Bottom to -60. Those spikes above -30dB are troublesome early reflections that we
should treat.
