Spectrum analysers give great insight into your sounds by deconstructing the so-called frequency spectrum to show the levels of the various frequencies present in an audio signal. Displayed as a graph, the horizontal axis is frequency and the vertical position gives the amplitude of those frequencies.
Reading the graph from left to right shows you the relative levels of the bass, middle and treble parts of the sound. So, a huge 'bump' on the left-hand side of the graph means the signal has a ton of bass; a hump in the middle means the midrange is prominent; a steep downward slope on the right means the treble is dull, and so on.
Typically, spectrum analysers display frequencies from 20Hz to 20kHz = the range of human hearing - while the vertical axis is in decibels.
As well as giving feedback on individual sounds, spectral analysis is particularly useful when checking the overall balance of frequencies within a mix or the relationship between individual elements of a mix. This becomes even more important when mixing with less-than-great monitors and/or in a room that has not been acoustically treated, which might mislead you into creating an unbalanced mix; for instance, if your monitors/room make bass seem quiet and indistinct, you may boost the bass way too much to try and compensate, resulting in a mix that sounds boomy and amateurish when played elsewhere.
"Spectral analysis is particularly useful when checking the overall balance of frequencies within a mix or the relationship between individual elements of a mix."
It's always good practice to compare (or 'reference') your track against a suitable commercial release, and a spectrum analyser is an excellent way to make that comparison more objective.
Block/window size
The majority of spectrum analyser plugins use a Fast Fourier Transform (FFT) algorithm to break complex sounds down into many frequency bands - make these bands narrow enough, and we can effectively see the levels of individual frequencies within a sound. The resolution can typically be adjusted through a parameter known as 'block size' (sometimes called window or FFT size), which is a reflection of the number of samples analysed at a time.
Put simply, setting the block size to 64 means that a new measurement will be taken for every 64 samples of audio - this won't give a detailed frequency breakdown, but it will yield a rapidly updating frequency curve. Setting the block size to 65536, however, will provide very detailed frequency information, but a slow, jerky refresh rate. A frequency analyser will often provide an Overlap function, which can alleviate jerkiness.
"The majority of spectrum analyser plugins use a Fast Fourier Transform (FFT) algorithm to break complex sounds down into many frequency bands."
A crucial point to note is that FFT frequency resolution is linear; that is, if the block size is set such that frequency is divided into 100Hz-sized bands, this will divide the octave from 10-20kHz into 100 parts - easily enough to give us a graph where we can discern individual notes in that range. However, at the lower end of the scale, 0-100Hz will be represented by just one band - we won't be able to pick out individual frequencies below 100Hz, only the overall level.
You may therefore need to increase the resolution (block size) to get an accurate picture of your low end, but this could lead to an overload of information further up the scale, which ironically can make it harder to grasp what the graph is really saying.
Some analysers have a smoothing feature to help with this, usually grouping bands together according to octave or sub-divisions of an octave. A smoothing setting of one octave will break a full bandwidth resolution of 20Hz to 20kHz into ten bands, each an octave in width, giving you a digestible breakdown of your mix's energy. Some analysers will display these simplified readouts as bar graphs; others will display them as smoothed graphs with no distinct banding.

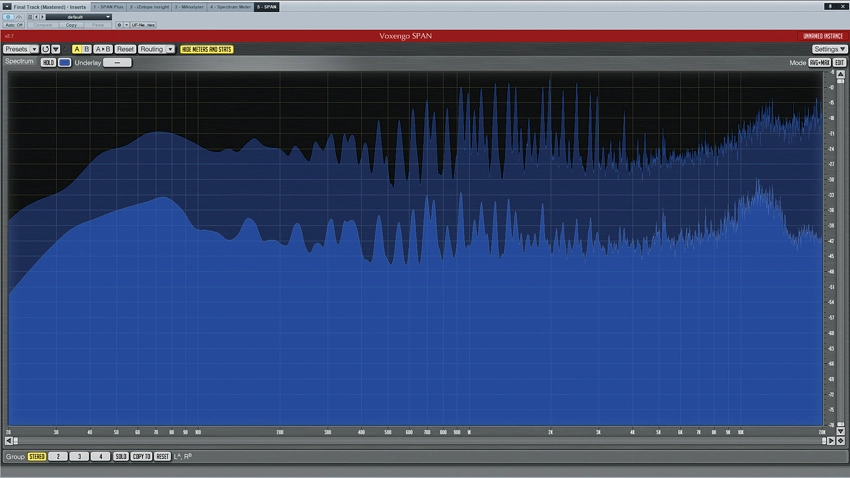
This analyser is running in a 1/3 octave mode, where each bar of the graph represents one third of an octave.
Experimentation will ultimately help you to decide which mode to use when, but usually you'll want high resolution when trying to identify problem frequencies or resonances, and a smoother, less-defined setting when trying to get the big picture during mastering.
Further options
The default mode for spectrum analysers is to show peak amplitudes of frequencies, but this can often be switched to a mode where the amplitudes are averaged over a certain period of time (eg, the last five seconds), giving a much more stable view of the general frequency curve of the signal.
Some analysers will also average 'infinitely' (well, until you click on the graph to reset it), and in this mode, the graph will gradually 'stabilise'. This is very useful when you need to view a track's general frequency curve during mixdown or mastering.
"One interesting point to note is that a mix that is EQed to sound flat will not necessarily look so on the graph."
Many analysers let you view the instantaneous 'real-time' and 'average' curves simultaneously on the same graph. You'll normally also have a variety of peak hold options that will keep peak amplitudes displayed for a user-defined time.
One interesting point to note is that a mix that is EQed to sound flat will not necessarily look so on the graph. This is because our hearing does not respond to all frequencies equally; for instance, 80dB at 100Hz sounds quieter to us than 80dB at 1kHz. In fact, many analysers artificially adjust the slope of the display so that what looks flat on the graph does sound relatively flat to us, and the common setting here is between 3 and 4.5dB/octave, approximating our ears' response. A well-balanced mix viewed using a 3dB/octave slope setting would have a mostly flat appearance, sloping neither up nor down by very much.
For a complete guide to visual mixing check out the June issue of Computer Music magazine (CM204).
