How to use a spectrum analyser to help with EQing
Spectrum analysers can be invaluable when it comes to frequency shaping. We show you why…
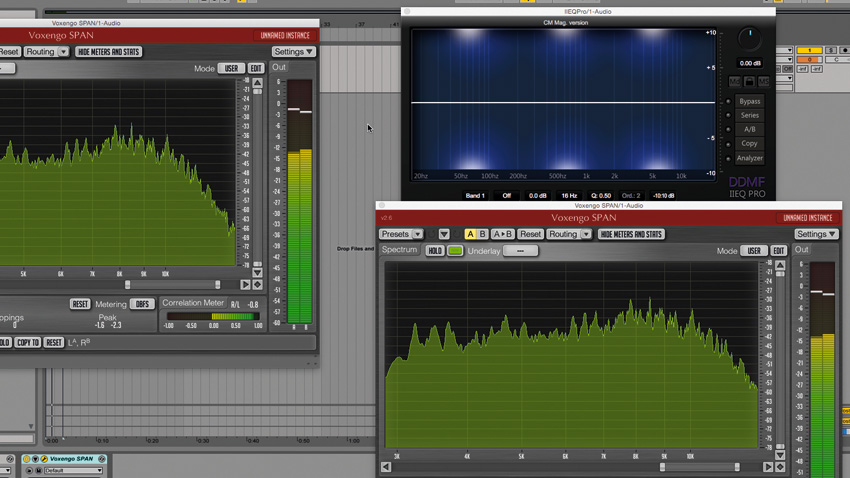
While our ears are the ultimate judge of whether or not a mix is satisfactory, no human ear or item of reproductive equipment is perfect. As such, sometimes it can help to use visual aids when EQing. Spectrum analysers - visual feedback tools that display the frequency content of a signal - are now widely available in plugin form. You don't even have to pay for one, as there are excellent freeware options such as SPAN by Voxengo and MAnalyzer by MeldaProduction.
Spectrum analysers typically display frequency information across the horizontal axis and amplitude on the vertical axis. If you've never used such a plugin yourself, this might sound complex, but in practice, they're really very intuitive, and indeed, many contemporary EQ plugins now include integrated spectrum analyser displays. In the case of FabFilter's state-of-the-art Pro-Q 2, for example, the display shows both the unprocessed and processed signals along with the EQ curve, making it easy to see how the audio has been affected by the equalisation that you've dialled in.
Analyse this
While EQs with in-built analysis offer an elegant workflow, it's possible to achieve similar functionality using a dedicated analyser, which will often offer more detailed options in terms of the actual analysis. In the following tutorial, we'll demonstrate how we can use a combination of equaliser and spectrum analyser effects to locate problem frequencies in an unprocessed signal, equalise them, then view the processed signal in another analyser.
We'll also show you how to configure the analysers' settings to make it as easy as possible to see what's happening with the incoming signal. Indeed, most analyser effects have a plethora of customisation options, and it's worth experimenting with these to tailor the results to your requirements.
Before we begin, a word of warning: Although spectrum analysers can be incredibly useful when working towards your ideal mix, it's vital to remember that how the music actually sounds is what's important! As such, rest your ears occasionally and review your EQ choices to make sure that you're not overcooking things.
For much more advice on using EQ plugins, including walkthroughs, tips and 20 video tutorials, pick up Computer Music 215, which is on sale now.
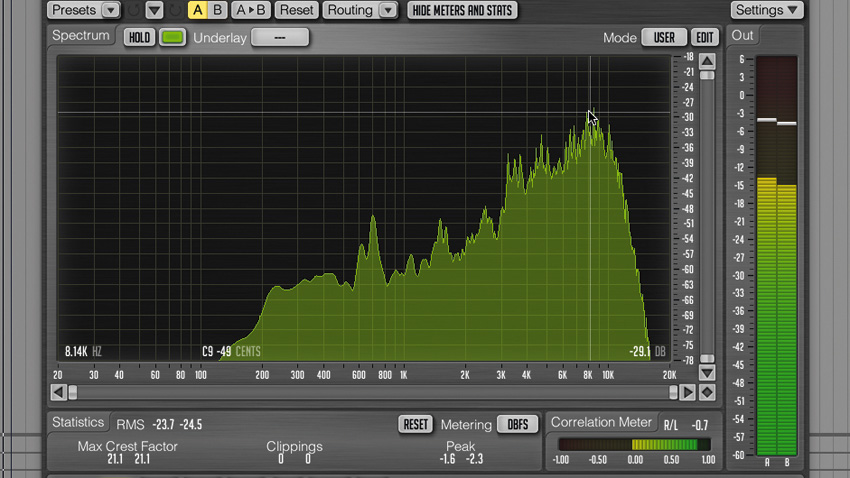
Step 1: Drag Hats.wav onto an audio track, and add the free Voxengo SPAN as an insert on the track. Play the audio back and you'll see its frequency content displayed in SPAN, ranging from low (bass) to high (treble) on the horizontal axis. We can see peaks in the 8kHz region, and hovering your cursor over the display will show the specific frequency and amplitude in the lower left/right corners of the graph.
Want all the hottest music and gear news, reviews, deals, features and more, direct to your inbox? Sign up here.
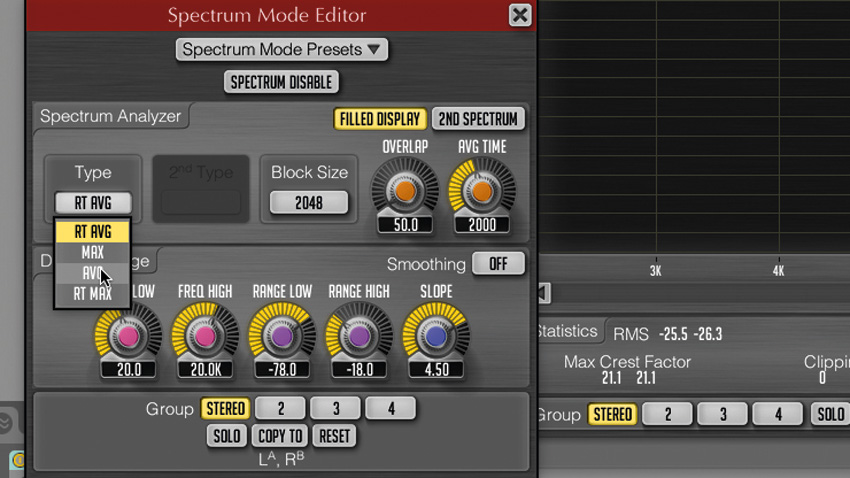
Step 2: We can get a more accurate picture of where the peaks are by zooming in - just drag the edges of the scroll bar at the bottom of the display. To make discerning the peaks even easier, put SPAN into averaging mode. To do this, click the Edit button at the top right-hand corner of the display to bring up the Spectrum Mode Editor window, and set the Type to AVG. Close the window with the X.
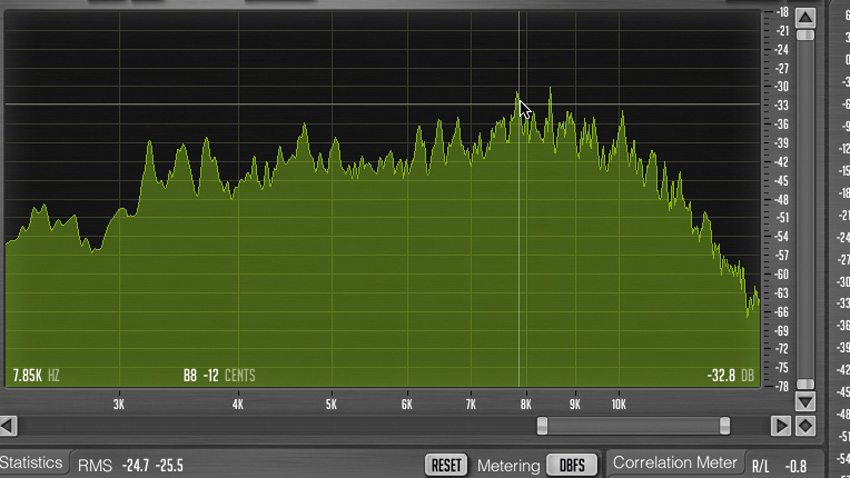
Step 3: You'll see that the spectrum display gradually stops undulating in time with the audio, and eventually - barring any changes to the input signal - stabilises to become entirely still. Zoomed in and in AVG mode, we can clearly see that the peaks at 7.82kHz and 8.47kHz sit at about 3dB above the rest of the signal. Let's use EQ to tame these peaks.

Step 4: Add IIEQ Pro CM (which comes with Computer Music magazine every month) after SPAN, then create a copy of SPAN after the EQ. This means we've got two spectrum analysers on the channel: one before the EQ and one after. This duplicated instance of SPAN will automatically be set to AVG mode, but it won't be zoomed in, so do that now. With this arrangement, we can observe the frequency content of both the processed and unprocessed signals.
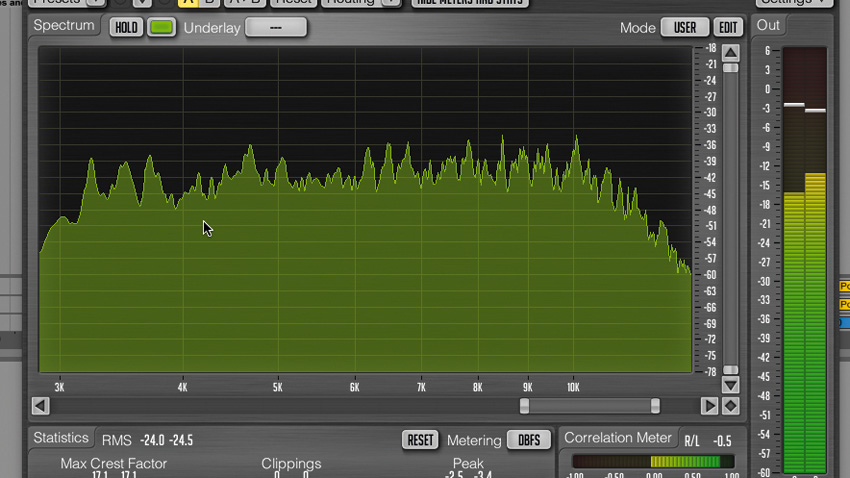
Step 5: In IIEQ Pro CM, set the first two bands to Ana Peak mode, and put the first at 7.82kHz and the second at 8.47kHz. Set both bands to -3dB, and turn each's Q up to 6.50. Now in the post-EQ analyser, you'll see that the peaks in the high-end all sit at a more even level. Bypassing the EQ and listening to the unprocessed signal shows how the equalisation has taken the harshness out of the highs.
Computer Music magazine is the world’s best selling publication dedicated solely to making great music with your Mac or PC computer. Each issue it brings its lucky readers the best in cutting-edge tutorials, need-to-know, expert software reviews and even all the tools you actually need to make great music today, courtesy of our legendary CM Plugin Suite.
