Mixing is one huge balancing act. Volume levels, frequency conflicts, dynamics, panning, stereo balance and overall coherence must all be considered, with the ultimate goal of creating an end result that sounds great on a multitude of playback systems.
Inadequate monitoring, acoustics and experience are all factors that can affect our ability to accurately judge our sounds' characteristics in a mix, but luckily, today's computer musician has a whole host of visual metering and analysis methods to assist them. Studios have long since used dedicated meters to keep an eye on signal levels, with more advanced offerings now available in plugin form.
But there's so much more we can keep an eye on: we can take a look at a spectrum analyser to observe a signal's relative frequency balance in real time; a track's stereo information can be plotted on a phase meter, making it easy to ascertain width and panning amounts; waveforms can be monitored on the fly using an oscilloscope; and so on.
What's more, these tools can be used to inspect the properties of reference tracks that we know sound great everywhere, helping us to recreate the characteristics found in a 'good' mix.
Here are 10 tips and tricks that are designed to help you to get more out of your visual mixing tools. For a complete guide to the subject check out the June issue of Computer Music magazine (CM204), which is on sale now.
Import your favourite mixes
Visual analysis tools are brilliant for deconstructing commercial tracks for referencing purposes. Import a WAV (not an MP3) and use frequency analysis, stereo metering, RMS metering and basic waveform inspection to get a feel for how your favourite mixes work. You can then take this information and aim for similar characteristics in your own mixes.
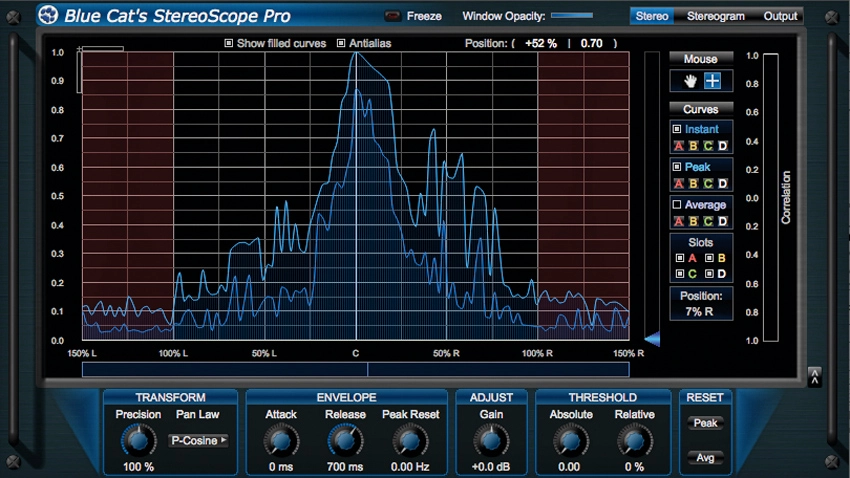
Use two analysers
It's possible to use a dedicated plugin to plot individual track elements' curves on a single analyser display. If your frequency analyser doesn't have this function, simply open up two separate analyser instances onto two separate tracks and compare their curves side-by-side.
Use presets
To help save time, make presets of your favourite metering settings so that you can instantly recall them for different situations (such as fast analysis for drums; slow, smoothed analysis for mastering; etc). Your meter plugin may already have ready- to-go presets built in for this, so take time to check out its preset menu.

Combine tools
Frequency analysers and equalisers go hand-in-hand - it's handy to see what's going on frequency-wise as you sculpt a sound with EQ. Better still, many modern EQ plugins (such as FabFilter's Pro-Q, DMG Audio's EQuilibrium and EQuality (shown above), Logic's Channel EQ and Live 9's EQ Eight) now combine these and feature an in-built spectrum analyser to aid with frequency adjustment directly on the analyser curve.
Inspect your melodies
Want to deconstruct the melodic makeup of your signals? Photosounder's Spiral CM, available as part of the Computer Music Plugins collection, can do just that. This handy musical visualisation tool will plot a signal's frequencies on a circular spiral graph, so each musical note is clearly represented, allowing you to pick out notes, replicate chords and more.

Sort out your display
It's highly useful to visualise frequency, levels/dynamics and stereo width information all on a single display at the same time - a task made easier by all-in-one analysis solutions like iZotope's Insight, shown above. If you don't have access to such a plugin, use a second monitor screen and arrange your individual analysis plugins permanently on this display.
Love your curves
Some frequency analysers let you take a 'snapshot' of a curve for later comparison, and you can even build up a library of your favourite curves - reference tracks, perfectly-weighted basses, ideal kicks, and more. If your analyser doesn't have this feature, you can always use your OS's screen capture function as a quick 'n' dirty way to grab curves as image files for later recall!
Fix your frequencies
Voxengo's free SPAN analyser has a handy function for picking out rogue frequencies. Hold Ctrl on PC, or Cmd on Mac, then click and hold anywhere on the analyser's frequency display. The plugin will apply a band-pass filter over your signal at the desired frequency area - perfect for homing in on rogue frequencies.

Mid/side mastery
Many analysers offer a mid/side mode so you can compare separate frequency curves for the mono and stereo information on the same graph. If you don't have an analyser that supports it, simply use a M/S isolation plugin (such as the free Voxengo MSED or Brainworx's bx_solo, shown above) before the analyser to flip between M and S and see what's happening on the two channels.
Look... and listen
Finally, it's a point we can't avoid when discussing analysis methods: use your ears! Audio is, of course, primarily about what you're hearing, and these techniques only really work when combined with the sound coming out of your speakers or headphones. To avoid relying on visual metering, turn off your screen once in a while to prevent your eyes from distracting your ears
