In the box: the ultimate beginner's guide to digital audio
Let’s find out exactly what’s going on ‘inside the box’ as we go back to first principles
It’s entirely possible to make music on a computer without having the faintest idea of how digital audio works, but a little knowledge can go a long way when it comes to pushing the medium to its limits.
For those unfamiliar with the basics of how sound works, let’s start at square one. Some of the following explanations might seem a little abstract out of the context of actual mixing, but introducing these ideas now is important, as they’ll be referenced when we get more hands-on later in the issue.
Sound is the oscillation (that is, waves) of pressure through a medium – air, for example. When these waves hit our tympanic membranes (eardrums), the air vibration is converted to a vibration in the fluid that fills the channels of the inner ear. These channels also host cells with microscopic ‘hairs’ (called stereocilia) that release chemical neurotransmitters when pushed hard enough by the vibrations in the fluid. It’s these neurotransmitters that tell our brain what we’re listening to.
The process of recording audio works by converting the pressure waves in the air into an electrical signal. For example, when we (used to) record using a microphone feeding into a tape recorder, the transducer in the mic converts the pressure oscillation in the air into an electrical signal, which is fed to the tape head, which polarises the magnetic particles on the tape running over it in direct proportion to the signal.
The movement of sound through air – and, indeed, the signal recorded to tape – is what we’d call an analogue signal. That means that it’s continuous – it moves smoothly from one ‘value’ to the next without ‘stepping’, even under the most microscopic of scrutiny.
By the numbers
Computers are, for the most part, digital, which means they read and write information as discrete values – that is, a string of numbers. So, how do computers turn a smooth waveform of infinite resolution into a series of numbers that they can understand?
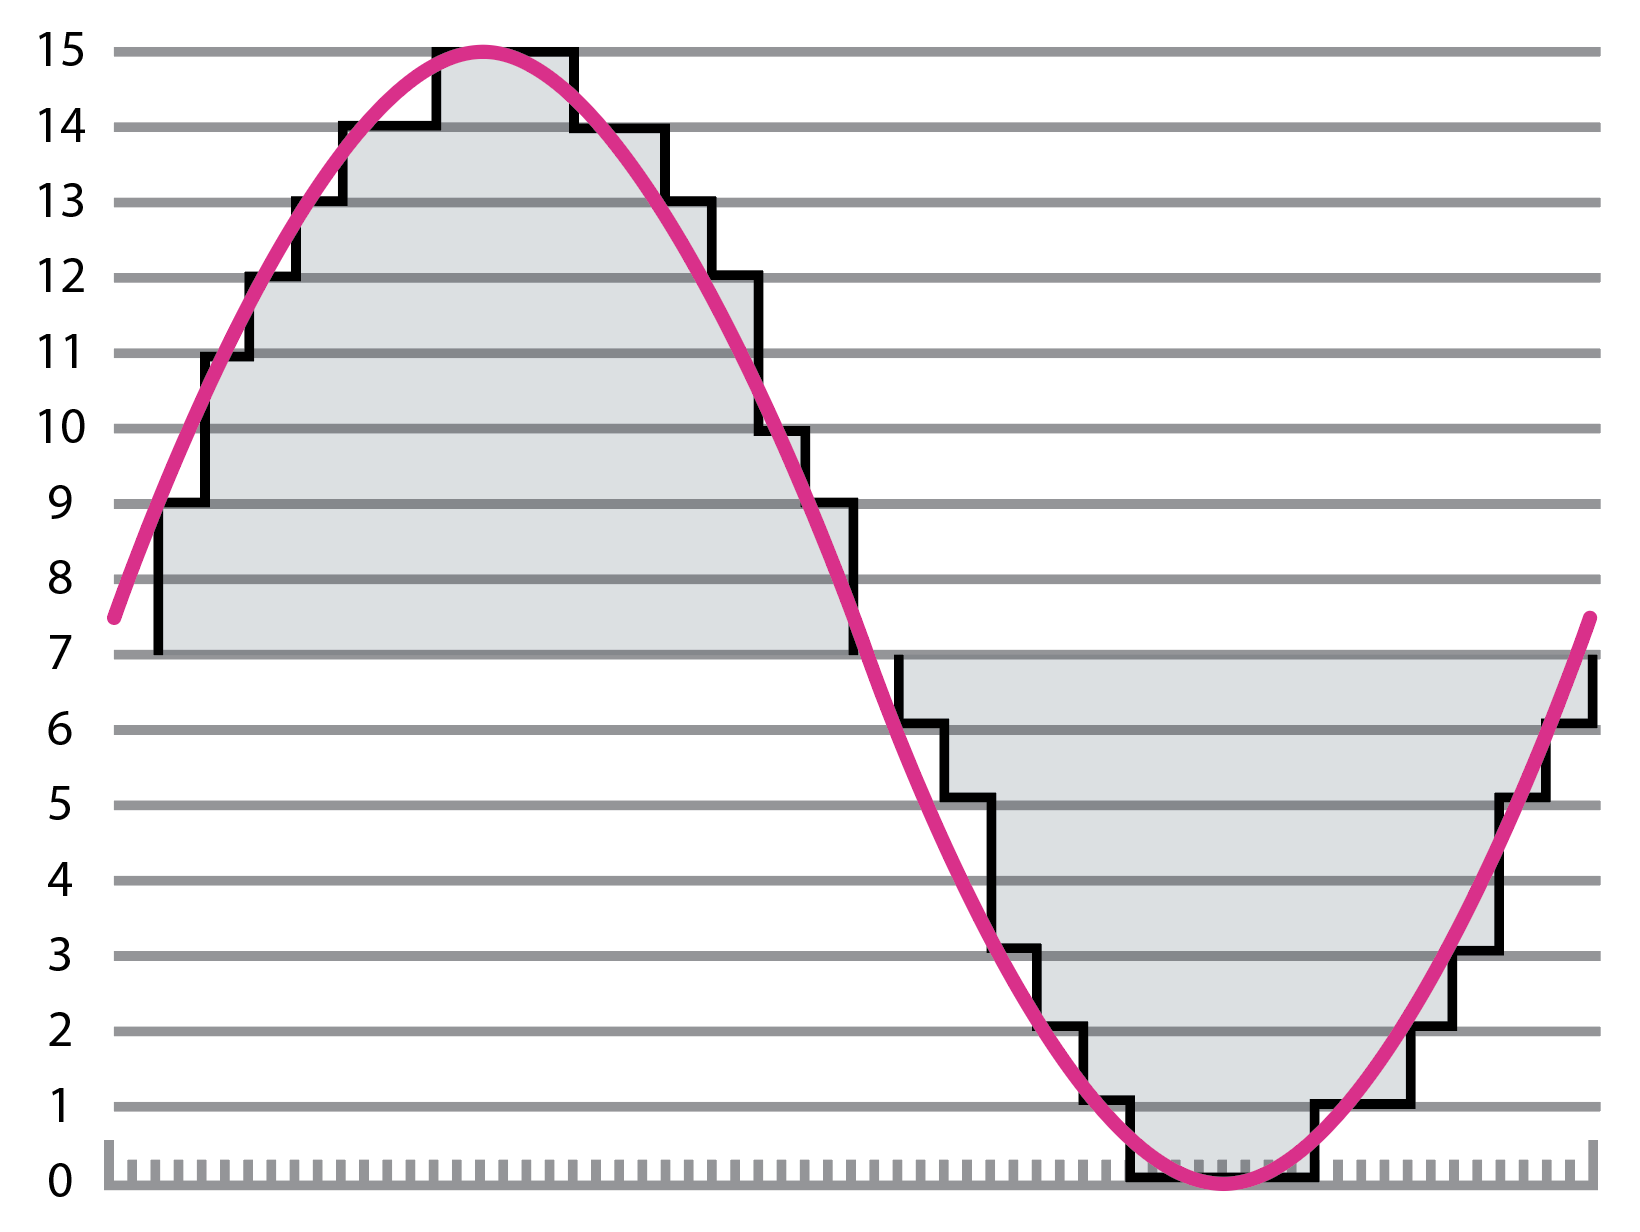
The answer is a method called pulse code modulation (PCM), which is the main system employed when working with digital audio information. It starts with the process of analogue-to-digital conversion (ADC), which involves measuring the value of the continuous signal at regular intervals and creating a facsimile of the original waveform. The higher the frequency at which the signal is referenced – or ‘sampled’ – and the greater the precision of the value that’s recorded, the closer to the original waveform the digital recording will be (see Fig. 1).
Want all the hottest music and gear news, reviews, deals, features and more, direct to your inbox? Sign up here.
The number of samples taken per second is called the sampling rate. CD-quality audio is at a sampling rate of 44.1kHz, meaning that the audio signal is sampled a whopping 44,100 times per second. This gives us a pretty smooth representation of even high frequencies – the higher the frequency we want to measure accurately, the higher the sampling rate required.
That figure – 44.1kHz – is pretty specific, and there’s a reason for that: the highest frequency that can be represented by PCM audio is exactly half of the sample rate, and the human ear can hear frequencies from around 20Hz to 20kHz, so at the top end that’s 20,000 oscillations (or cycles) per second. This is where we encounter the Nyquist–Shannon sampling theorem, which deals with how often a sample of a signal needs to be taken for it to be reconstructed accurately.
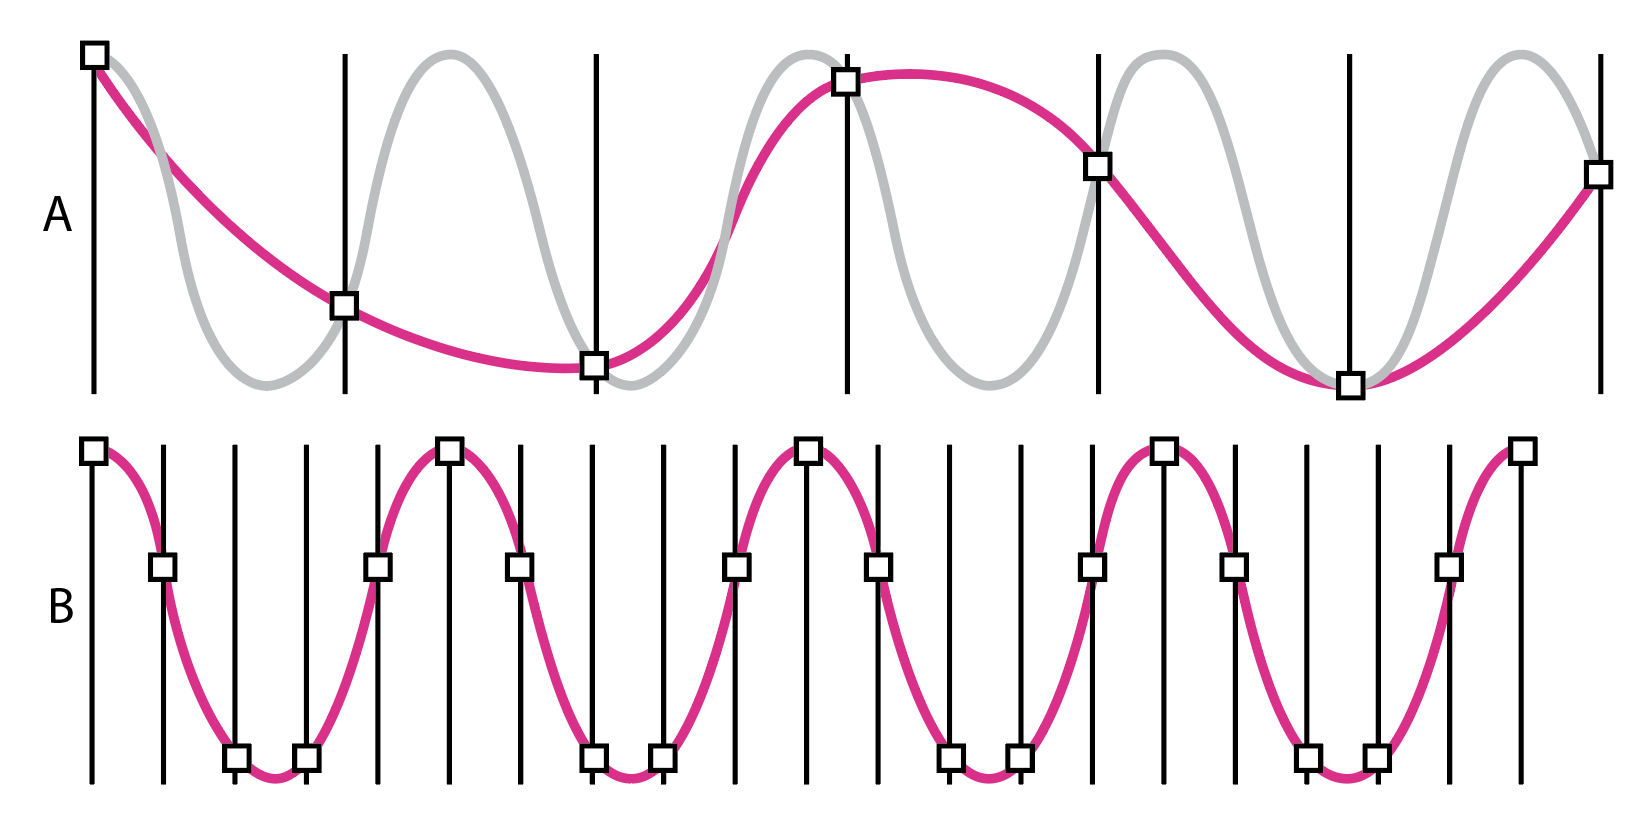
The theorem states that the sampling rate needs to be double the highest frequency, lest what’s known as aliasing occurs (see Fig. 2). Aliasing causes unmusical artefacts in the sound, as frequencies higher than the sample rate will be “reflected” around the Nyquist frequency, which is half the sample rate. So at 44.1kHz, Nyquist is 22,050Hz, and if we try to sample, say, 25,050Hz (22,050Hz plus 3000Hz), we’ll instead get 19,050Hz (22,050Hz minus 3000Hz). As frequencies above 20kHz or so can’t be perceived by the human ear, they’re not massively useful anyway.
In ADC, what’s known as an anti-aliasing filter is used to band-limit the sound, stopping any frequency higher than half the sampling rate from getting through. So, that 44.1kHz rate gives us double our 20kHz, plus a bit of extra room for the low-pass filter to filter out the unwanted high-end signal. 44.1kHz was the de facto digital playback standard through the CD era, although much higher sample rates are now common.
Once our sample has been taken, it needs to be stored as a number. You probably already know that CD quality audio is 16-bit – but what, exactly, is a bit? A bit (short for binary digit) is the most fundamental unit of information in computing, and can have one of two values – usually represented as 1 or 0. If we add another bit, we double the number of available states: for two bits, the number of available states would be four (two to the power of two) – that is, 00, 01, 10 and 11.
Four bits would allow for 16 states (two to the power of four), eight bits would allow for 256 states (two to the power of eight), and 16 bits a massive 65,536 possible states (two to the power of 16). So, we’ve gone from a primitive ‘on or off’ state at 1-bit to having quite a fine resolution at 16-bit. See Fig. 3 for a visual representation of this.
A bit random
When an analogue-to-digital converter samples an analogue signal and rounds it up or down to the nearest available level, as dictated by the number of available bits, we get ‘quantisation error’ or ‘quantisation distortion’. This is the difference between the original analogue signal and its digital facsimile, and can be considered an additional stochastic signal known as ‘quantisation noise’. A stochastic signal is non-deterministic, exhibiting different behaviour every time it’s observed – a random signal, in other words.
So, in a digital recording, we get our ‘noise floor’ (the smallest measurement we can take with any certainty) from the number of bits we’re using. This is known as ‘word size’ or ‘word length’. For every bit we add to the word length, we get twice the number of possible states for each sample, doubling the dynamic range with another 6dB or so of headroom over the noise floor.
For example, a 16-bit digital recording at CD quality gives us a hypothetical 96dB of dynamic range. It might surprise you to learn that this is actually higher than the dynamic range of vinyl, which is more like 80dB. If you’re unfamiliar with decibels and dynamic range, don’t worry – we’ll come back to them shortly.
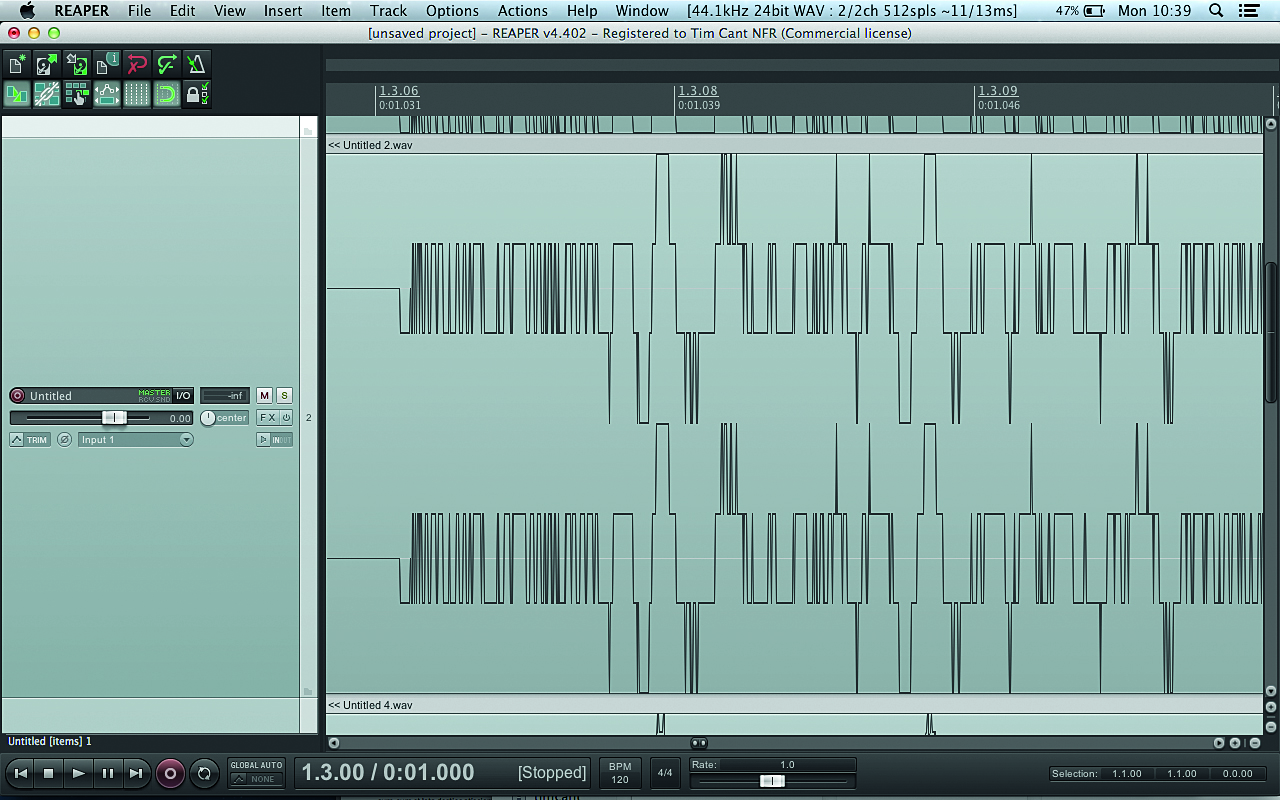
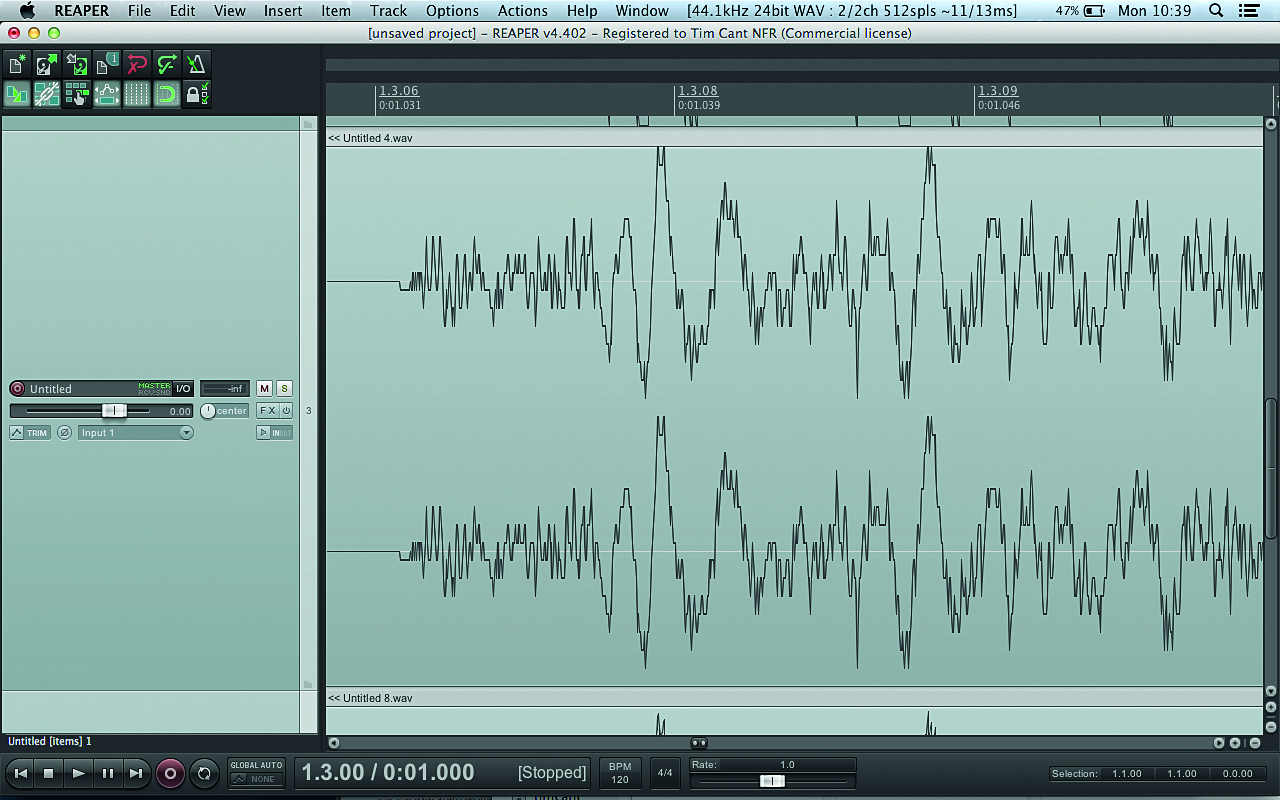
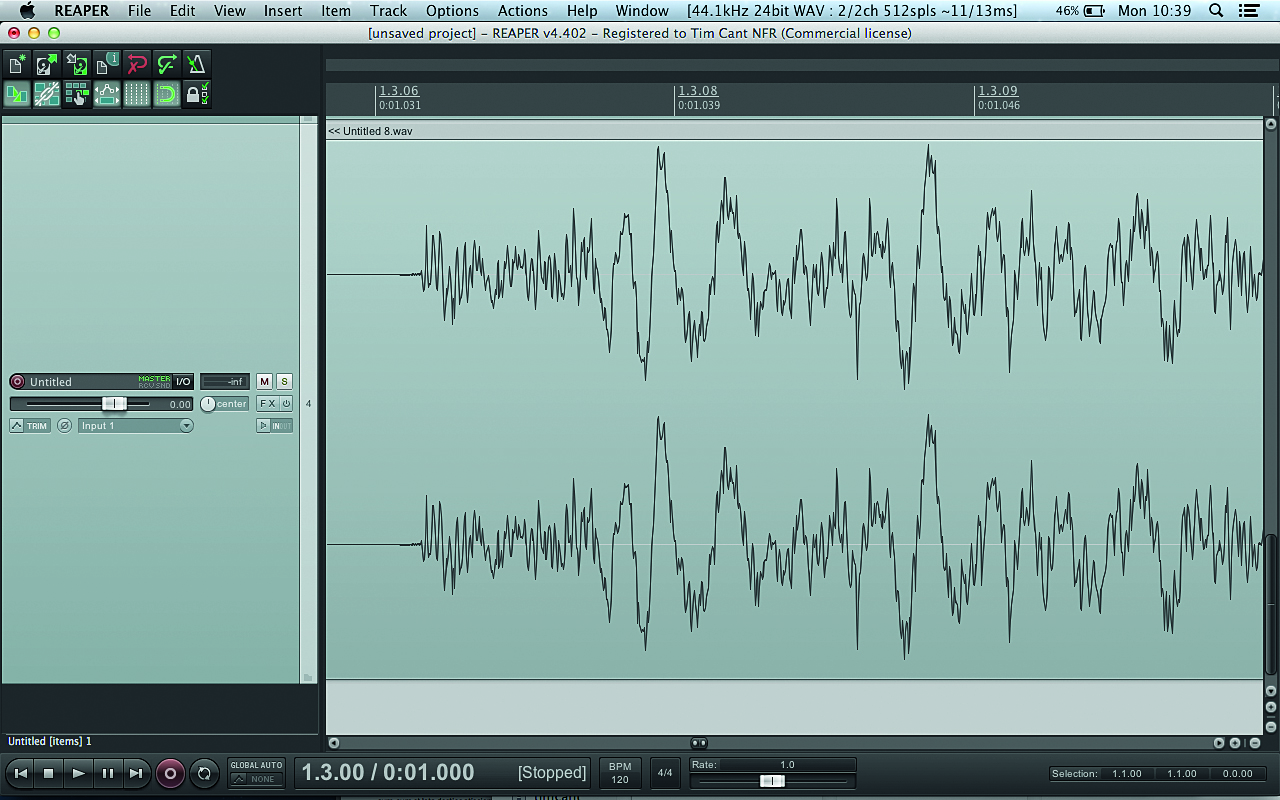
As you can see by looking at the same sample at different bit depths, changing bit depth doesn’t affect how loud a sample can go; it just affects the volume resolution of the waveform. A common misconception is that increasing bit depth only improves the resolution at lower volume levels, but this clearly illustrates that the increase in resolution improves the accuracy of the signal across the entire amplitude.
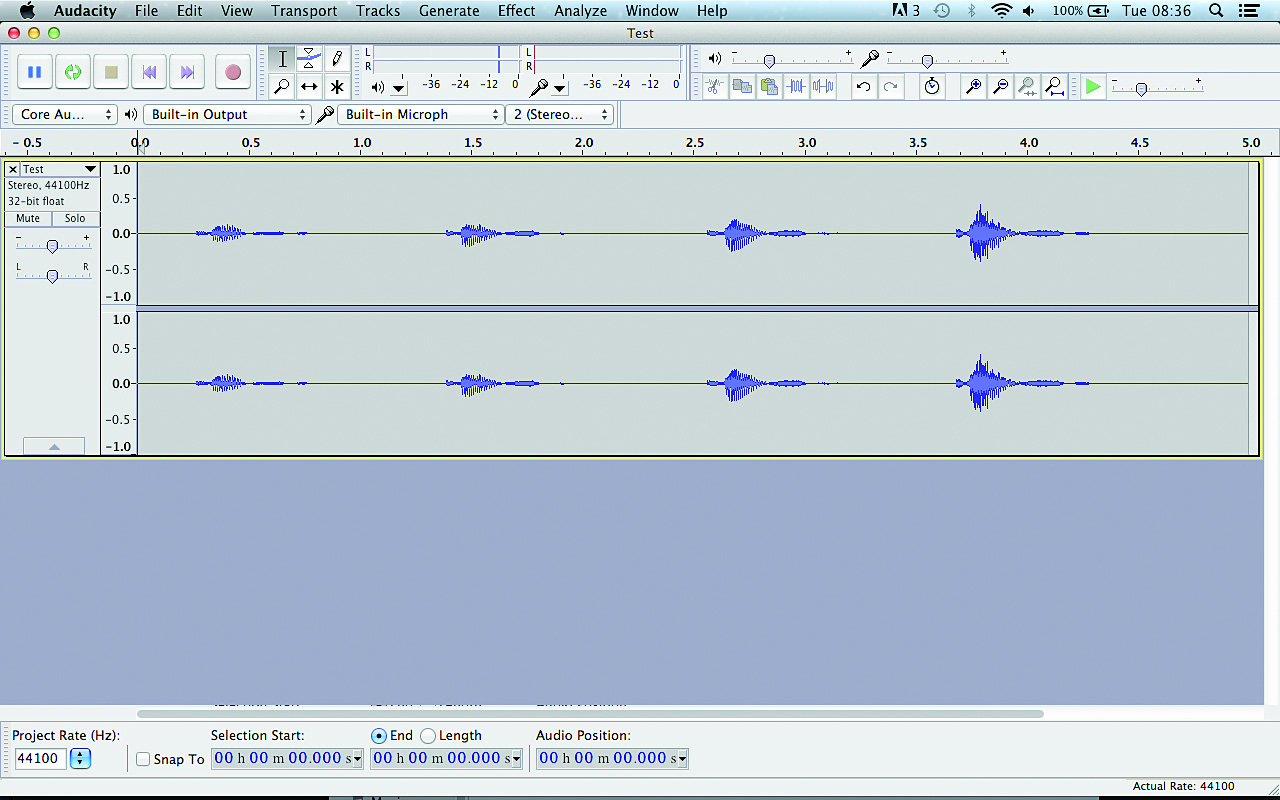
If you’re new to music production and this all seems very abstract, perhaps a practical example will bring things into focus. Install the free audio editor Audacity, launch it and set the input to your computer’s built-in microphone. Click the record button, and repeatedly speak the word “test” into the microphone, quietly at first, then getting louder each time. You should see something like the image below: a series of similar waveforms that increase in size on the vertical axis.
Testing, testing
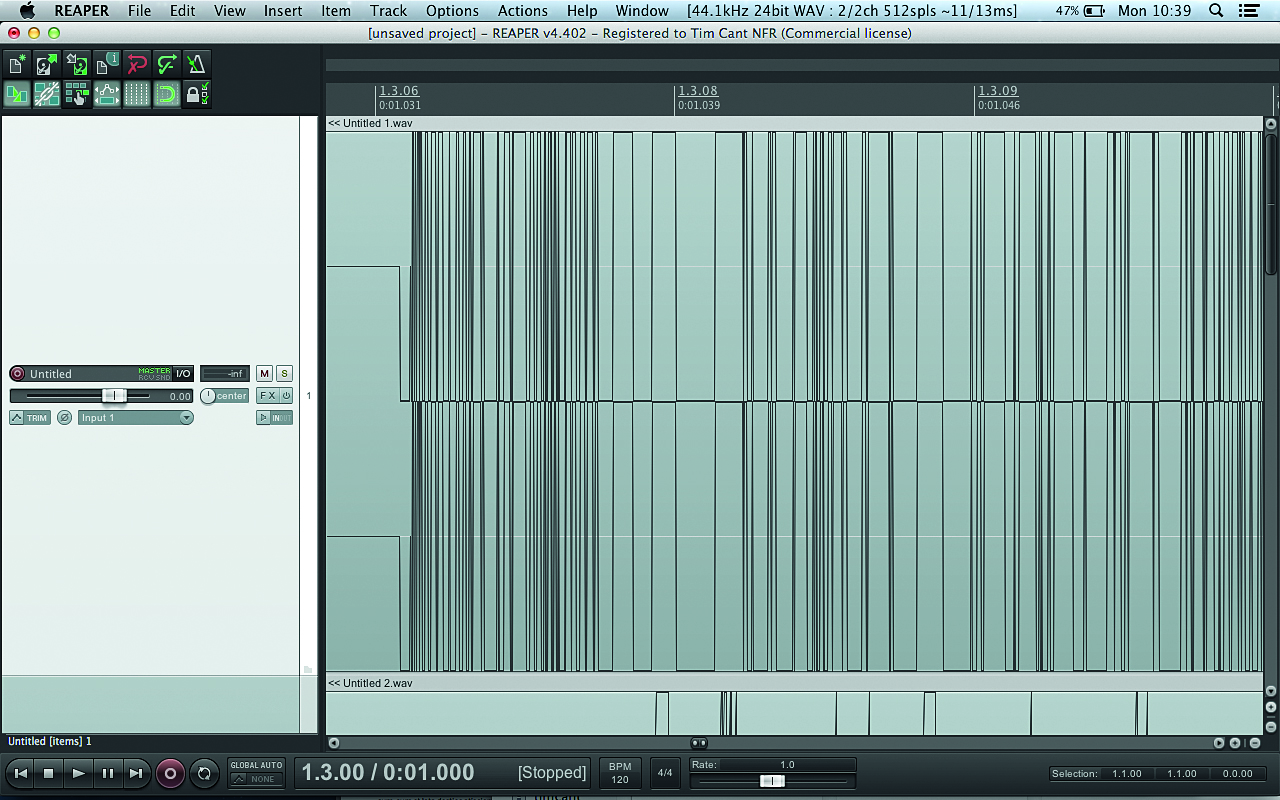
Let’s take a look at our recording up close. Click the first “test”, then hold the Cmd key on Mac or Ctrl on PC and press 1 to zoom in on the waveform. The waveform will look continuous, but once you’ve zoomed in close enough, you’ll see discrete points representing the levels of individual samples – see Fig. 5.
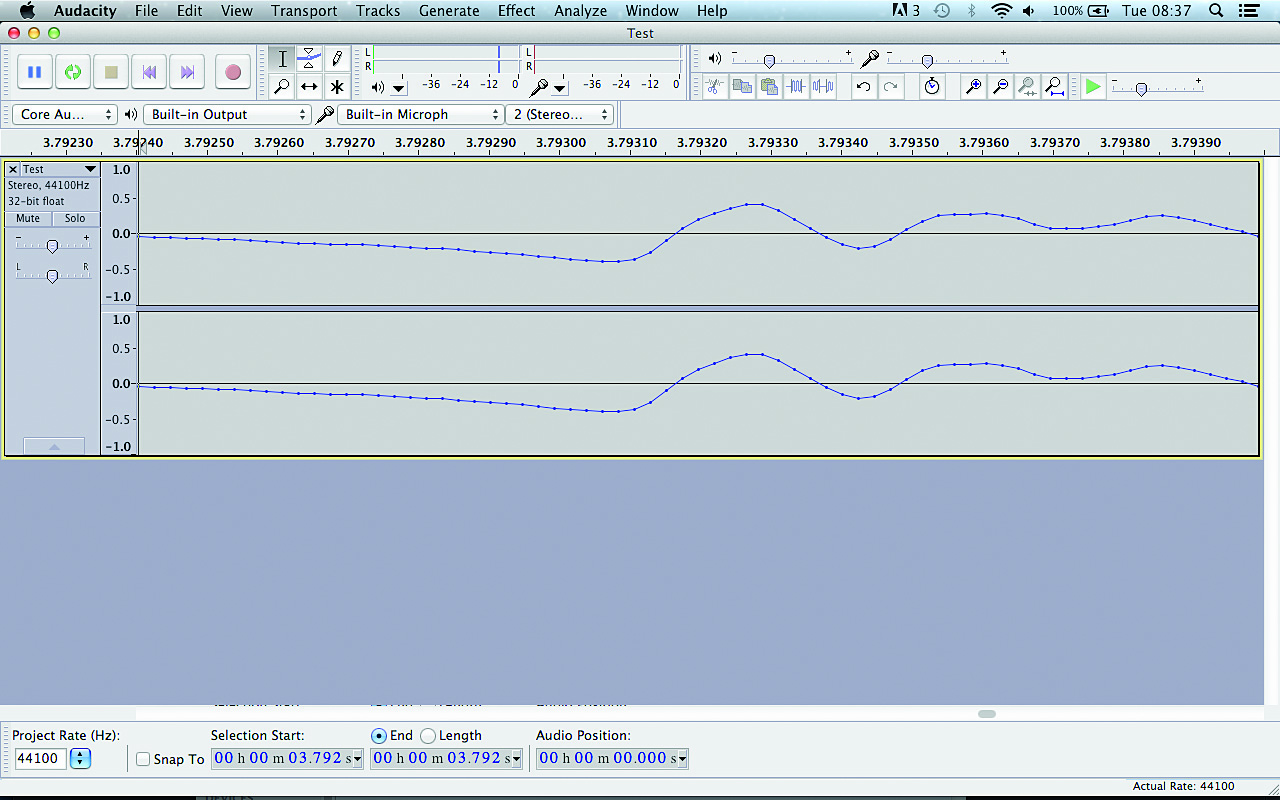
Hold Cmd/Ctrl again and press 3 to zoom out and see the entire waveform. The increase in vertical size represents the words increasing in volume, or amplitude. Now click the loudest “test” and zoom in on it. At the loudest points, the waveform will approach or even reach the +1.0/-1.0 points of the vertical axis. No matter what bit depth you use, +/-1 is the loudest level your recorded signal can be.
However, the greater the bit depth, the more accurate the waveform, and this is particularly important when dealing with signals that contain both loud and quiet elements – percussive sounds, for example. This is because more bits give us more dynamic range.
Dynamic range is the ratio of the largest and smallest possible values of a variable such as amplitude, and it can be expressed in terms of decibels (dB), which we’ll get into in more detail later. In simple terms, it’s the difference in dB between the loudest and softest parts of the signal.
Dynamic range is the ratio of the largest and smallest possible values of a variable such as amplitude
Here’s an example of dynamic range in action that most of us will be familiar with: you’re watching a movie late at night, trying to keep the volume at a level that isn’t going to disturb anyone. The trouble is, the scenes in which the characters talk to each other are too quiet, while the scenes with guns and explosions are too loud! Wouldn’t it be better if the movie’s soundtrack was at a consistent volume level?
Well, for late-night home viewing, maybe; but in a cinema, it’s the difference in amplitude between the characters’ dialogue and the explosions that gives the latter their impact. As such, having a broad dynamic range is important in film soundtracks, as well as classical music, where you’ll get much quieter sections than you ever would in a dance track. For example, take a listen to the fourth movement of Dvořák’s New World Symphony below, which features very delicate, restrained sections and intense crescendos. Dynamic range is important in club music too, though, because it helps keep the percussive sounds punchy.
Range finder
The importance of dynamic range becomes very apparent when compressing drum sounds. For the uninitiated, compression is a process whereby the dynamic range of a signal is reduced to get a sound with a louder average level. Once the level of the signal exceeds a certain volume, the amount it goes over that threshold is reduced by a ratio set by the user.
To compensate for the overall drop in volume that this introduces, the compressor’s output is then boosted so that it peaks at the same level as the uncompressed signal. As the average level is now higher, thanks to the reduction in dynamic range, it sounds louder – see Fig. 6.
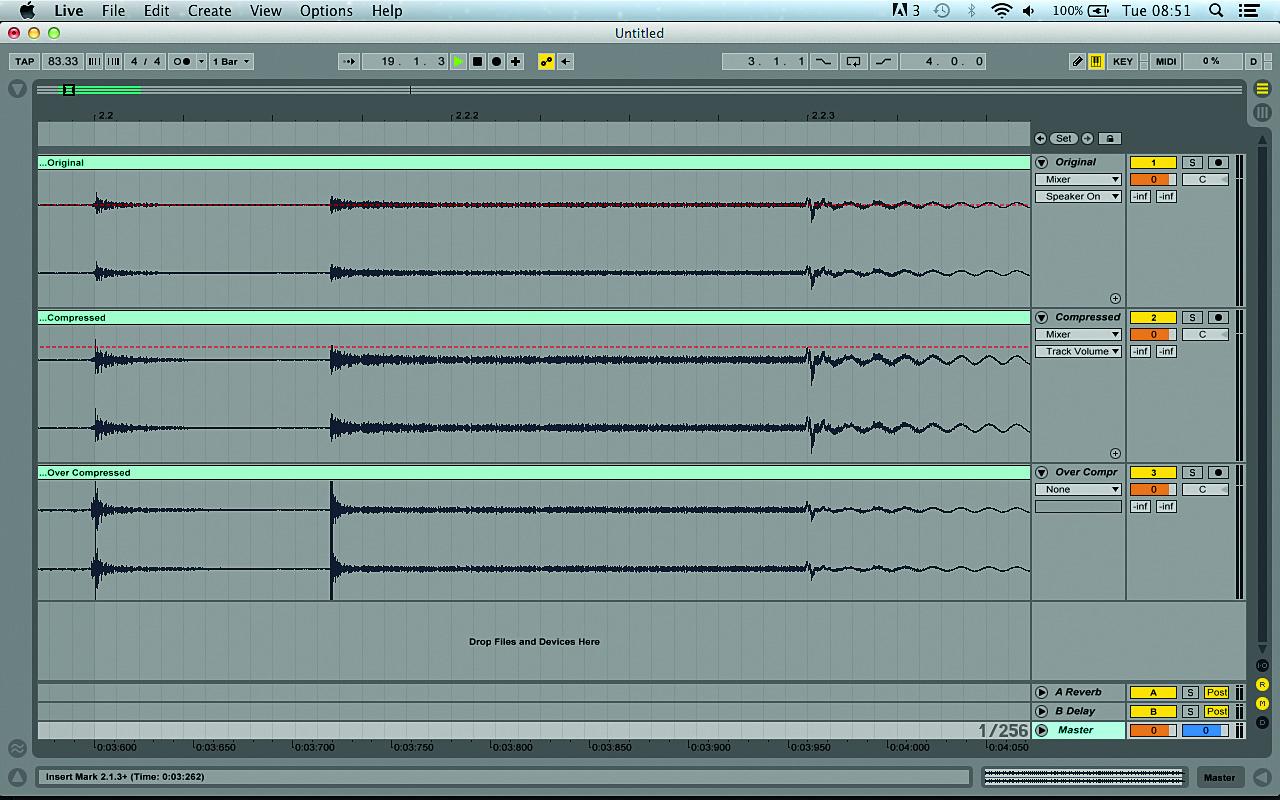
However, too much compression can suck the life out of a sound, making it feel flabby and weak. Getting the right balance between sounds with punch, but also maintaining high average volume, is one of the most important aspects of mixing for club play.
Generally speaking – and up to a point – the louder music gets, the better it sounds. Sadly, as we’ve seen, our waveform can only get so loud: once all the bits have been set to 1 and we’ve reached the 65,536th step, there’s nowhere else for the audio information to go! So, what happens if we’re recording a signal that’s too ‘hot’ (that is, too loud) for our system?
In this situation we get what’s known as digital clipping. When a signal exceeds the maximum capacity of the system, the top of the waveform is simply cut off, or ‘clipped’. This loss of information misrepresents the amplitude of the clipped waveform and produces erroneous higher frequencies. Although clipping can have its uses – which we’ll look at later in the issue – it’s generally undesirable and is the reason why we can’t just keep boosting the level of our mixes to get them as loud as we want.
As a music connoisseur, you’ve probably already noticed that some mixes actually sound a lot louder than others. Sometimes this is because their waveforms simply peak at a higher level, but not always – you might load up two tracks in your DAW and see that they look similar in terms of amplitude, but hear that one sounds a lot louder than the other.
This is where perceived volume comes into play. The human mind’s perception of loudness is based not just on the amplitude level at which a waveform peaks, but also on how long it remains that loud. Consequently, a better way to quantify the perceived volume of a sound is by measuring not its peak volume, but its RMS level.
RMS stands for ‘root mean square’, and is a method of calculating the average amplitude of a waveform over time. Say, for example, we try to calculate the mean amplitude of a sine wave. The result is going to be zero, no matter what its peak amplitude, because a sine wave rises and falls symmetrically around its centre origin.
Clearly, then, this isn’t a useful way to measure average amplitude. RMS (the square root of the mean of the squares of the original values) works better because it always gives a positive value by negating any negatives – it’s a measure of the magnitude of a set of numbers. So, a signal that has been compressed may have the same peak level as the uncompressed version, but its RMS level will be higher, making RMS a better indicator of perceived volume.
Talkin' loud
When we talk about signal levels, we use a logarithmic unit known as the decibel, or dB for short. Decibels represent the ratio between two different values, so we use them to describe amplitude relatively. For example, in digital audio, a signal at 0dBFS (0 decibels full scale) reaches the maximum possible peak level (+/-1.0) on the vertical axis.
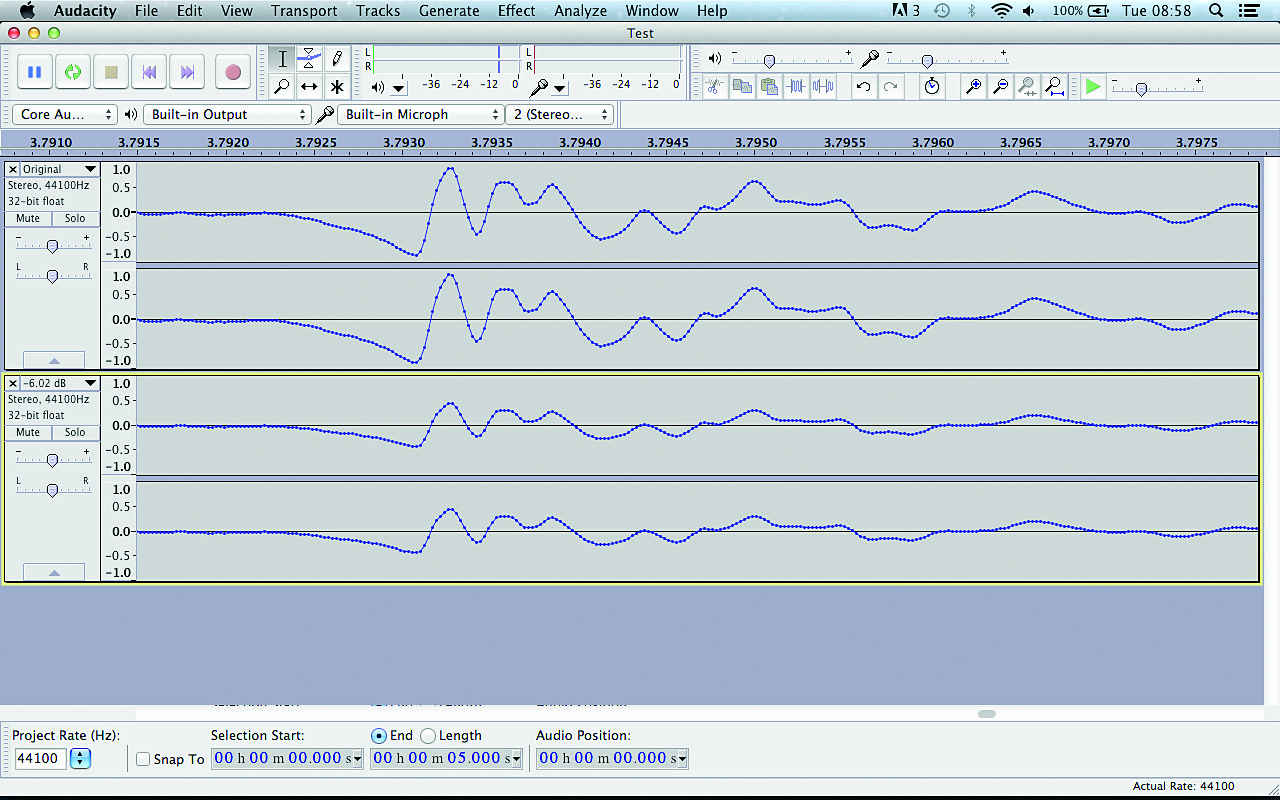
Putting it simply, +6dB doubles the amplitude of a signal, and -6dB halves it. If you want to get technical, it’s actually approximately +/-6.02dB (derived from 20 log 2). So, if we had a sine wave that peaked at 0dBFS, and amplified it by -6.02dB, it would peak at about +/-0.5. Each time we amplify the signal by -6.02dB, the peak level will fall by approximately half again. In terms of RMS, amplifying a signal by +/-6.02dB will give us four times the power or a quarter of the power respectively (see Fig. 7).
We calculate a period’s crest factor (the extremity of peaks in a waveform) by dividing its peak value by its RMS value. The resulting dB value will give us some idea of how dynamic a signal is. You can measure peak, RMS and crest factor dB using metering software such as Blue Cat Audio DP Meter Pro. Simply put it on your master channel, and as your track plays it’ll update the peak and RMS averages (the time settings of which can be adjusted) and resulting crest factor in real time.
So, part of the reason why two tracks can have such different perceived volume levels when they peak at the same level is that they likely have a higher RMS value. That’s not the whole story, though. There are many psychoacoustic factors that affect how loud something sounds to our ears, including its frequency content, how long it lasts and, crucially, its context in a track.
In the mix
This is where we actually get into the realms of arrangement and – finally! – mixing. At the most fundamental level, mixing two waveforms together is a really simple process: all your CPU has to do is add the level of each sample state together to calculate the total.
This happens in exactly the same way in all DAWs, and if someone tells you that a particular DAW’s summing engine has a certain ‘sound’ to it, they’re sadly misinformed. In fact, there’s a very simple test you can do to see for yourself how all DAWs sum signals in exactly the same way: simply load two or more audio tracks into the DAWs you want to test and bounce out a mixdown.
As long as you use the same settings (including any automatic fades, panning law and dithering) and haven’t done anything to alter the audio (such as apply timestretching), you’ll find that each DAW produces an identical file. Then load the exported files into a DAW and apply some polarity (often erroneously called phase) inversion – as long as all the files have been imported correctly and no effects have been applied by the DAW, they will cancel each other out perfectly, leaving nothing but silence.
Another thing worth bearing in mind about DAW mixers is that they use 32- or (now much more commonly) 64-bit ‘floating point’ summing to calculate what the mix should sound like before it’s either delivered to your ears via your audio interface and speakers or bounced to an audio file.
Floating point means that some of the bits are devoted to describing the exponent, which in layman’s terms means that it can be used to store a much wider array of values. Whereas fixed-point 16-bit has a range of 96dB, 32-bit floating point has a range of more than 1500dB!
This is clearly more headroom than we’d ever have any practical use for, and is the reason why pushing the level faders extremely high or low in your DAW’s mixer doesn’t really have a negative effect on the sound unless it’s passing through a plugin that doesn’t cope well with extremely high or low values, or is clipping the master channel.
In fact, you could run every channel on your mixer well into the red, but as long as the master channel isn’t clipping, no distortion of the signal would occur: 32-bit float can handle practically anything you can throw at it.
To get your mixes sounding as good as the competition it’s necessary to push your digital audio to its very limits
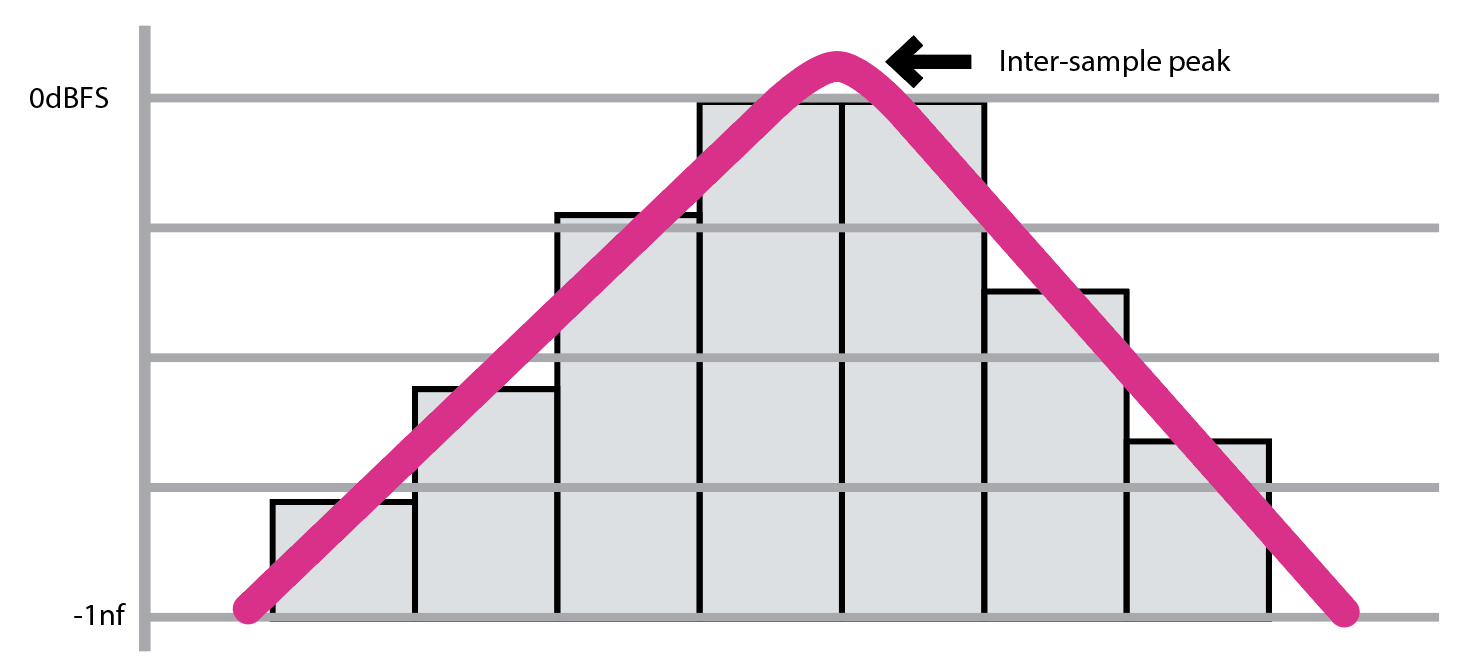
Running your DAW’s master channel into the red is a bad idea, because even if it’s not producing any audible distortion, you won’t really be able to trust what you’re hearing any more; this is due to the fact that different digital-to-analogue converters handle signals exceeding 0dBFS differently. Distortion can even be caused by signals that don’t clip!
This is known as inter-sample modulation, and it doesn’t occur within your DAW – it only happens once the signal has been converted from digital to analogue by your audio interface, specifically the digital-to-analogue converter’s (DAC’s) reconstruction filter. It’s what turns a stepped digital signal into a smooth analogue one, and as Fig. 8 (above left) shows, this process can cause problems when used with especially loud digital signals.
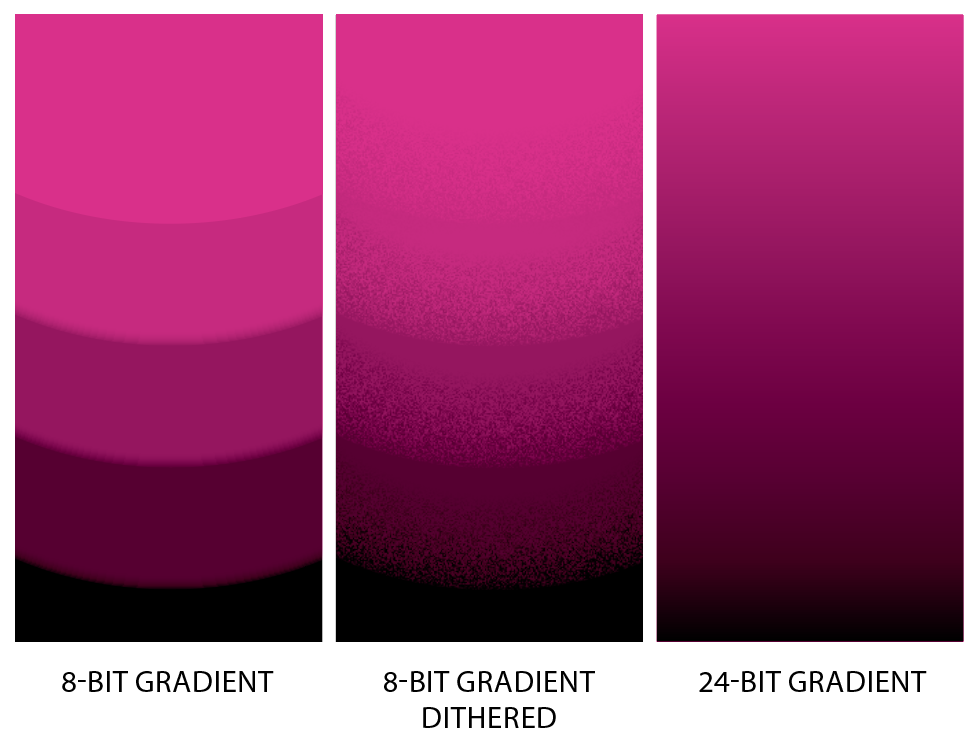
Whenever audio leaves your DAW – be it as sound or an audio file export – it’s converted from a 32- or 64-bit signal to a 16- or 24-bit one. When this happens, resolution is lost as less bits are used. This is where an oft-misunderstood process known as dithering comes into play, whereby a very low level of noise is added to the signal to increase its perceived dynamic range.
It works a little like this: imagine you want to paint a grey picture, but only have white and black paint. By painting very small squares of alternating white and black, you can create a third colour: grey. Dithering uses the same principle of rapidly alternating a bit’s state to create a seemingly wider range of values than would otherwise be available. See Fig. 9 for a visual example of dithering in action.
Dithering should be applied when lowering the bit rate. It’s therefore sensible to apply dither to your 32- or 64-bit mix when exporting it as a 16-bit WAV file to play in a club, or when supplying a 24-bit WAV file to a mastering engineer.
WAV and AIFF are uncompressed audio formats, which means that they’re suitable for using to transfer audio data between DAWs and audio editing applications. Compressed audio formats such as MP3 and M4A have the advantage of much smaller file sizes, but use psychoacoustic tricks to remove data from the signal that the human ear finds hard to perceive.
As such, these ‘lossy’ formats still sound great under normal consumer listening conditions, but they don’t behave exactly like their uncompressed counterparts when subjected to processing. While using an MP3 file as a source for, say, a master isn’t necessarily going to sound bad, the results will really depend on the material, the context it’s used in, and the encoding algorithm that’s been used to compress the sound. To be sure that the finished product sounds as good as possible, it pays to ensure that you use the highest-quality source material you can.
Moving on
The human ear and mind are surprisingly sensitive listening devices, and, as a result, it’s easy for someone who knows nothing about production to identify a bad or weak mix – it will simply sound less ‘good’ than other tracks.
This is especially important in a club environment, where the music is usually delivered in a non-stop stream, mixed together by a DJ. When the DJ uses the crossfader to quickly cut between channels on the mixer, it’s just like A/B-ing tracks in a studio environment: any deficiencies in the mixdown of either track compared to the other will be glaringly obvious!
To get your mixes sounding as good as the competition it’s necessary to push your digital audio to its very limits, and it’s only through understanding what those limits are that you can achieve this.


Computer Music magazine is the world’s best selling publication dedicated solely to making great music with your Mac or PC computer. Each issue it brings its lucky readers the best in cutting-edge tutorials, need-to-know, expert software reviews and even all the tools you actually need to make great music today, courtesy of our legendary CM Plugin Suite.
